Reporting & Analytics
Watch the field live: contact rates, territory progress, canvasser numbers, and survey results.
Answers early enough to act on
Built around the questions field programs actually ask.
Program Reporting
Numbers roll up from the door to the whole program without any spreadsheet surgery.
- Territory and activity reports
- Per-canvasser and per-team numbers
- Assignment history
- Program rollups
Survey Analytics
What voters actually said, cross-tabbed and trended over time.
- Survey results dashboards
- Cross-tabs
- Trends over time
- Data-quality flags from verification
Live View
Catch problems while the shift is still out and there’s time to fix them.
- Contact rates as they happen
- Completion by territory and group
- Bottlenecks visible early
- Decisions made same-day
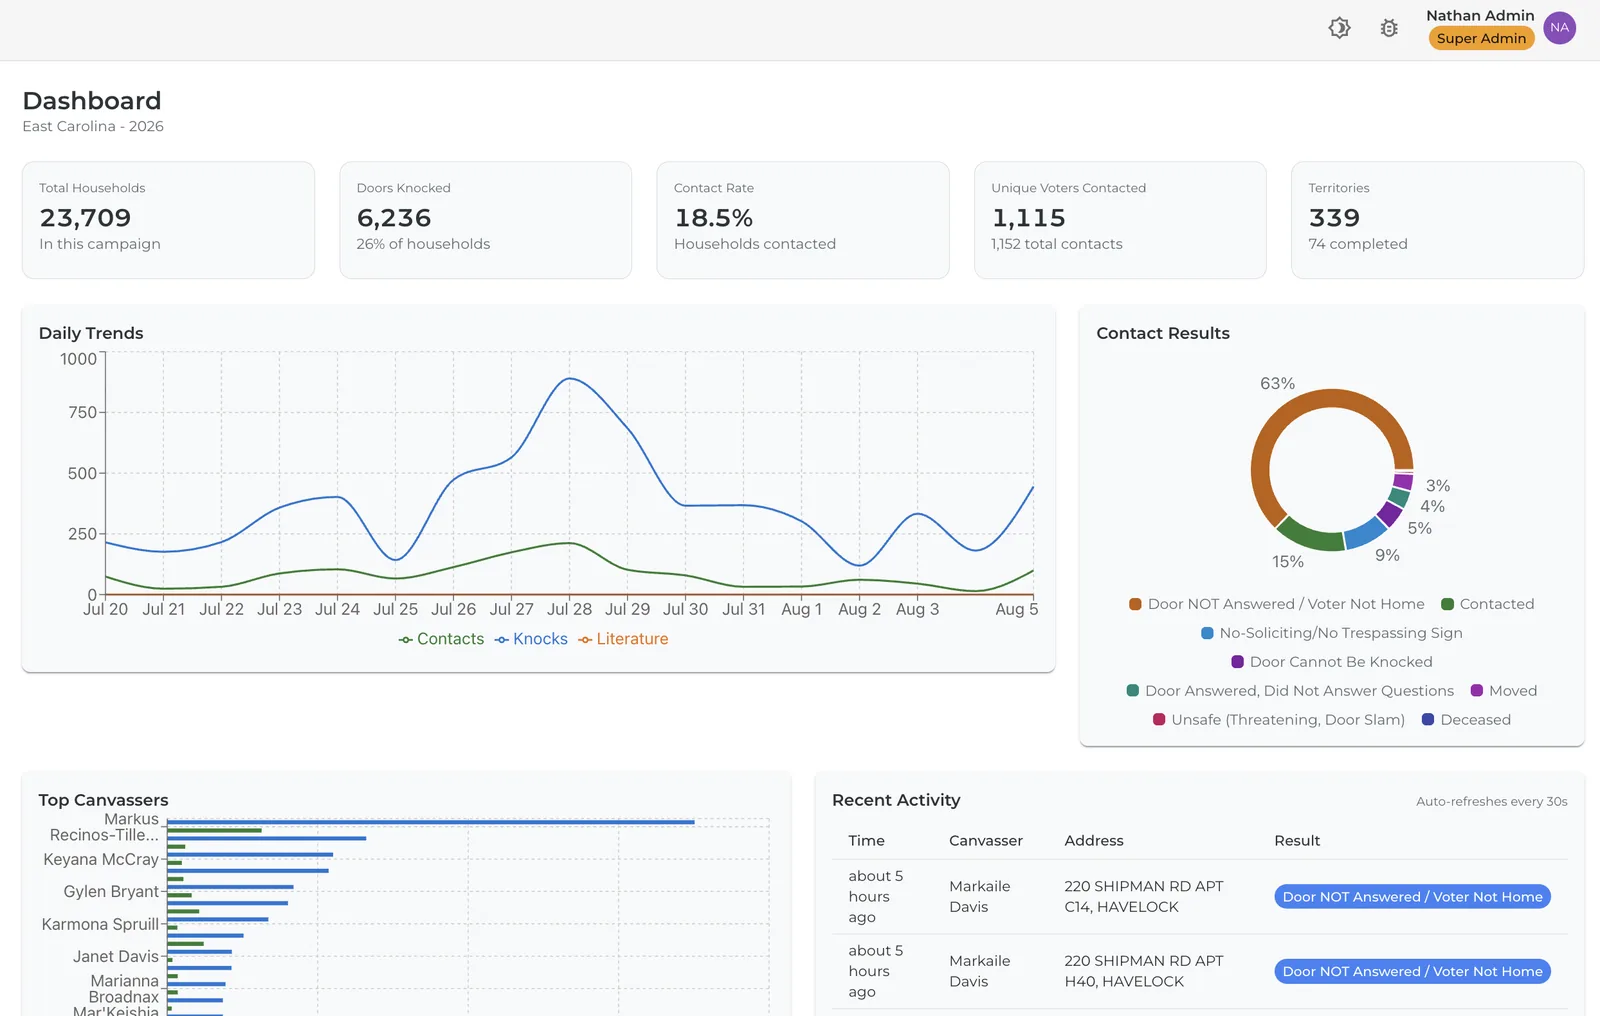
Numbers you can hand to anyone
In most field programs, reporting is a nightly ritual: exports pulled from one tool, attendance from another, a spreadsheet merge that somebody owns until midnight, and numbers that describe yesterday. The questions that matter — is this shift underperforming, which territory has stalled, which canvasser needs help — get answered a day late, when the shift is over and the doors are gone.
TouchStone replaces that ritual with a live view. Contact rates, completion by territory and group, and per-canvasser numbers update as contacts sync from the field, in the same dashboards our own field directors use to run programs. A bottleneck shows up while there’s still daylight to fix it, and a re-walk universe can be cut for the final weekend from data that’s hours old, not days.
Because knocks are checked at the door, the reports survive scrutiny. Donors, clients, leadership: same numbers, no asterisks.
Turn canvass results into lists and export them for mail, media, or the next program.
Reporting closes the loop that verification starts.
See your field in real time
We’ll walk through the dashboards, cross-tabs, and exports live, on your kind of program.